Meet Greg Fetisov: Your Dashboard Expert
from Dashboards Paradise
Hey there!
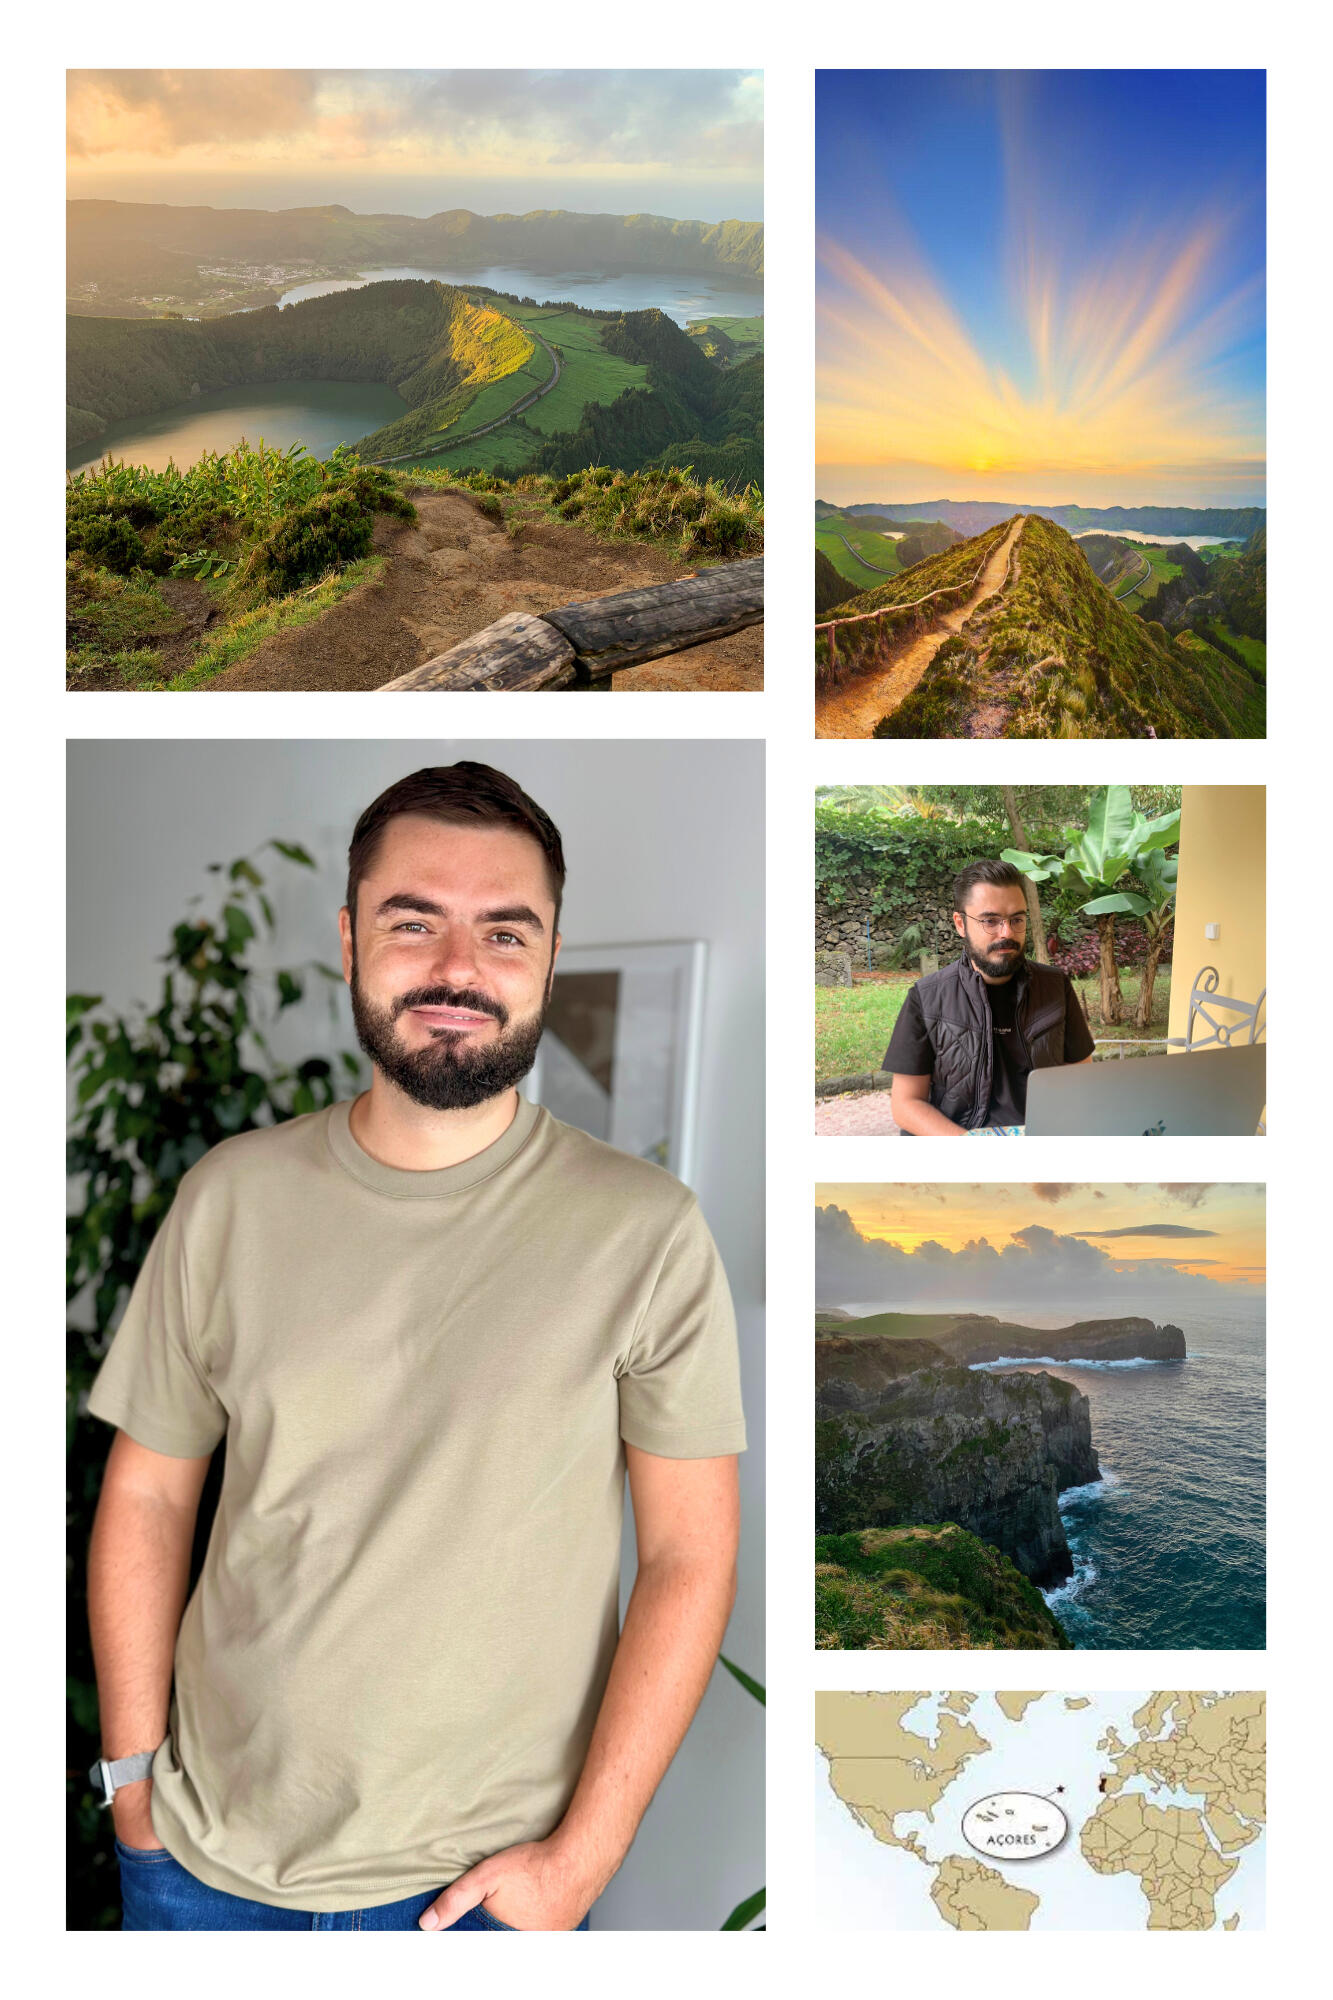
I'm Hryhorii (a.k.a. Greg) Fetisov, a Certified Business Intelligence freelancer.
I live in the Azores Islands (it's part of the European Union, Portugal), and my dashboards are inspired by the surrounding natural beauty, blending functionality with visual appeal. Rooted in a strong UX background and NYU-trained design sensibilities, my dashboards are not just efficient – they Load Fast and Look Great.
Having over 7 years of experience, I specialize in creating app-like, design-focused dashboards. My expertise, sharpened in the competitive landscapes of California startups and leading corporations, enables me to turn complex data into intuitive and aesthetically pleasing insights.
Let's meet and explore how we can transform your dashboard together.
I’m here to bring a touch of Azorean creativity to your dashboards!

Executive Dashboards
I do have successful experience working with Vice Presidents and C-level executives, including those with backgrounds at organizations like J.P. Morgan and Facebook. This experience has given me a deep understanding of the specific analytical and business needs at these high levels.
For you, this translates into a service that goes beyond creating visually appealing dashboards; I provide comprehensive business solutions, clear communication, and effective presentations tailored to executive standards.
My focus is on turning complex data into actionable insights, ensuring that the dashboards I craft align with your strategic goals and facilitate informed decision-making for leaders at every level in your organization.
New York University Expertise
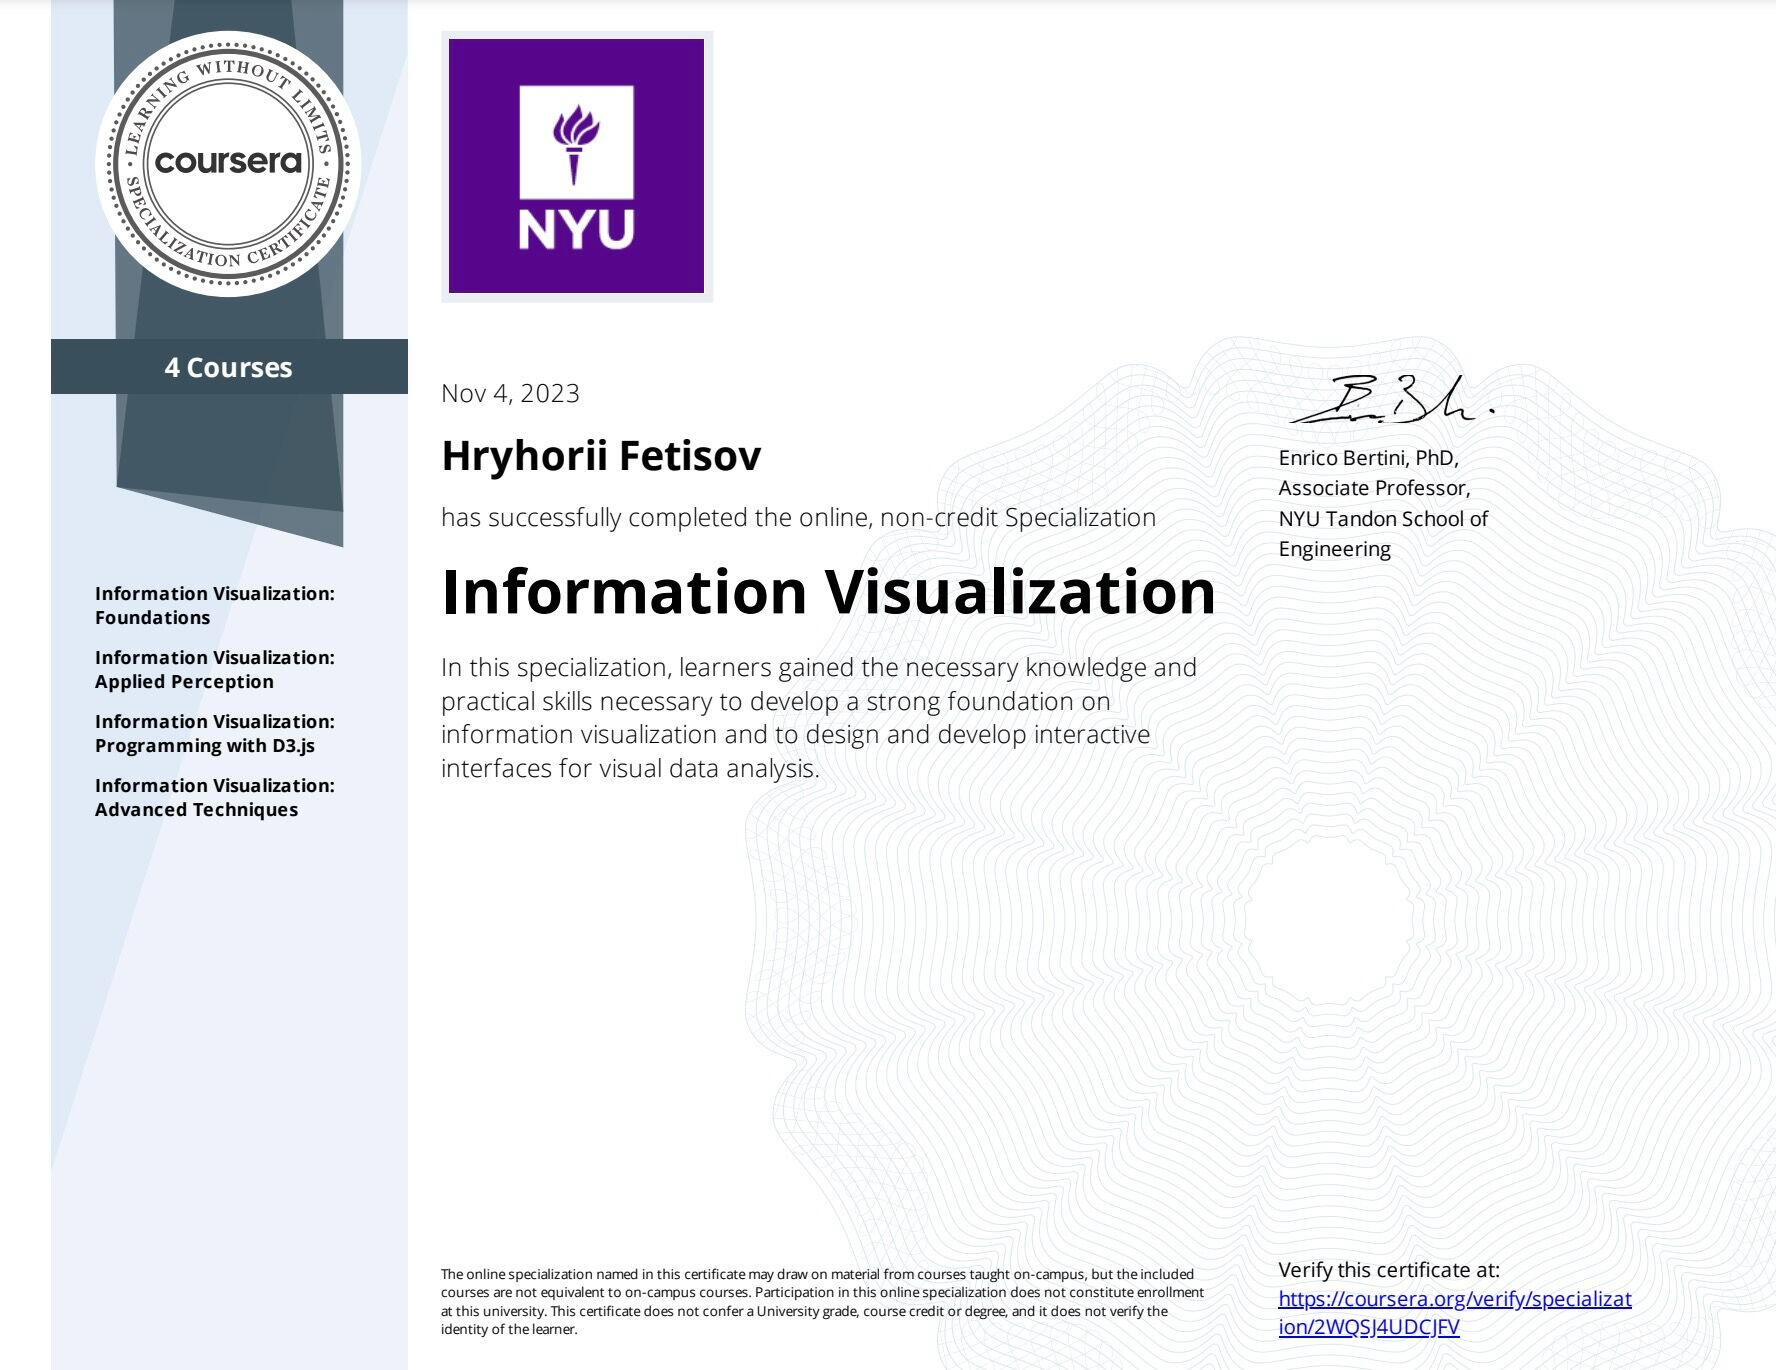
My completion of the 'Information Visualization' Specialization from New York University Tandon School of Engineering, via Coursera equips me with unique skills that directly benefit your dashboards. This feature of my professional profile means you're getting more than just data analysis; you're getting data storytelling shaped by NYU's cutting-edge practices.
NYU-Inspired Visualization Techniques: Leveraging the specialized techniques I've acquired, your dashboards will transform complex data into visually appealing, easily digestible stories, enhancing comprehension and engagement.
Practical and Impactful Design: The specialization's focus on practical application means your dashboards are designed not just for visual appeal but for maximum usability and clarity, ensuring they effectively communicate key insights.
Data Stories that Drive Decisions: With the knowledge gained from NYU, I craft dashboards that do more than display data; they narrate it compellingly, facilitating informed decisions and driving action.See my NYU credentials
Certified Experience
As a Tableau Certified Specialist, I don't just create dashboards; I craft experiences where precision, design, and functionality converge. This certification is your assurance of not only my skill but also my dedication to delivering the highest quality in data visualization.
Reliable Expertise: Trust in the power of certified proficiency. Every visualization I create adheres to the highest standards, ensuring your data is not only accurate but also compelling.
User-Centric Design: Balancing robust analytics with intuitive design, I ensure that your dashboards are as easy to navigate as they are on the eyes. This means turning complex data into engaging, understandable visuals.
Optimized Performance: Experience dashboards designed for efficiency. With a focus on speed and responsiveness, I empower you to access insights quicker, facilitating prompt, informed decision-making.See my certificate details
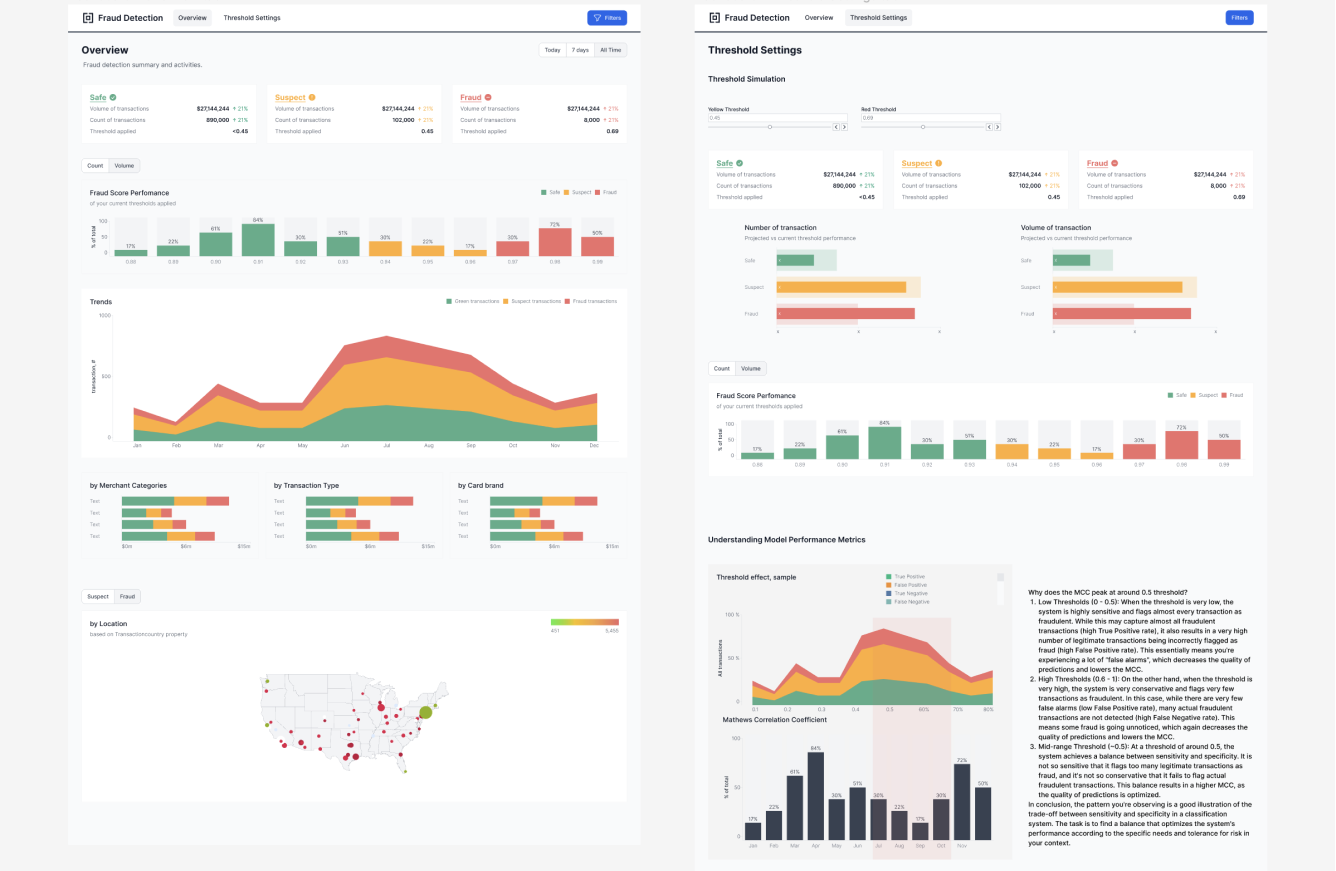
Dashboards Portfolio
Note: Many projects remain behind the curtain due to confidentiality agreements.


See Dashboards in Action
Checked out the dashboards above and want to see more? Book a demo to play around with them yourself.
See how they can fit into your day-to-day management and make things a bit easier for you and your team.
Book your Demo – No Commitment, Just Exploration.
We’ll never share your information with anyone.
Impactful Results Delivered to My Clients:
Multiplied B2B Customer Base
In a challenging yet rewarding project, I harnessed funnel analytics and Customer Acquisition Cost (CAC) insights to uncover growth opportunities for a client. Over the course of nine months, we significantly expanded their B2B customer base. My approach involved a detailed analysis of data, crafting targeted dashboards, and pinpointing crucial user segments. Working in tandem with marketing and sales teams, we developed tailored strategies that effectively enhanced our demand generation.
This effort not only rejuvenated segments of the customer base that were previously less engaged but also converted them into valuable, active customers. It was a clear demonstration of how a focused, data-driven strategy can lead to substantial growth in business.
10% Profit Increase in 6 Months
In a notable revenue operation project, I partnered with a client to unlock a substantial 10% increase in profits over a six-month period. The key? Deep sales data analysis coupled with the creation of intuitive dashboards. These tools provided us with a clear view of sales trends, customer preferences, and product performance.
This insight allowed us to strategically focus on high-performing products, refining our approach for maximum profitability. The outcome was a testament to the power of leveraging precise data insights for informed business decisions, leading to significant financial gains for my client.
Dashboards as Key Deal Winners
Imagine having a brilliant software idea but struggling to explain it to your customer. That's where I come in. Using my expertise in data visualization, I craft custom dashboards that bring your software concepts to life. These aren't just numbers and charts; they're like a sneak peek of your product in action, with a clean, user-friendly interface.
This approach has helped my clients give standout presentations and clinch major contracts. It's all about making complex ideas simple and visual, making it easier for your customers to see the potential and say 'yes'.
Want to see similar results in your organisation?
Book a 30-minute Intro Call with me to discuss dashboards tailored to your role’s objectives and challenges.
Together, we can turn your data into actionable insights that drive success in your position!
Your Journey to Dashboard Success:
My Process
Understanding Your Business
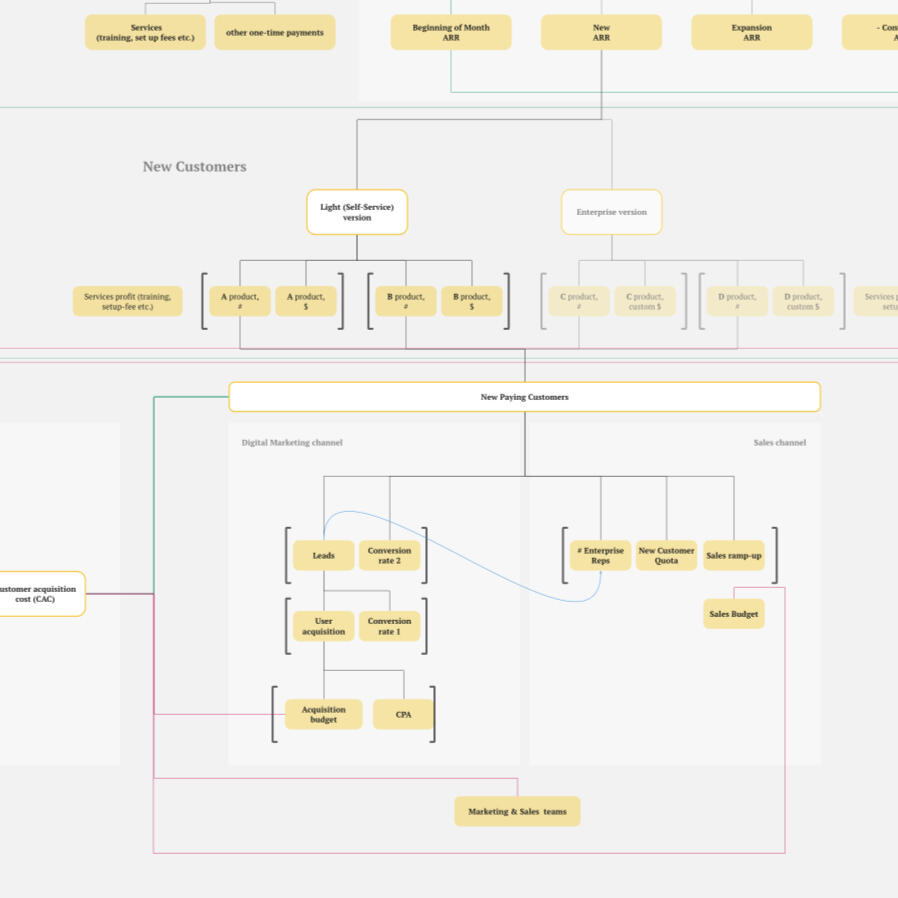
At the heart of every great dashboard is a deep understanding of your unique business needs. I dive into your world, intuitively identifying the metrics that matter most to your objectives. This stage often includes developing KPI Trees and an inventory of KPIs, ensuring every aspect of your business is accurately represented.🔍 Example of a KPI Tree Solution: To understand how I tackle complex KPI definitions, take a look at a KPI tree example here.
Figma prototyping
Visualize your dashboard before it’s even built. I create a detailed Figma high-fidelity prototype, offering you a clear preview of the final product. This approach ensures alignment with your expectations and significantly increases our success rate in delivering the perfect dashboard.🖌️ Preview a Figma Dashboard Mockup: View an example of my Figma mockup to visualize what I can create for you.
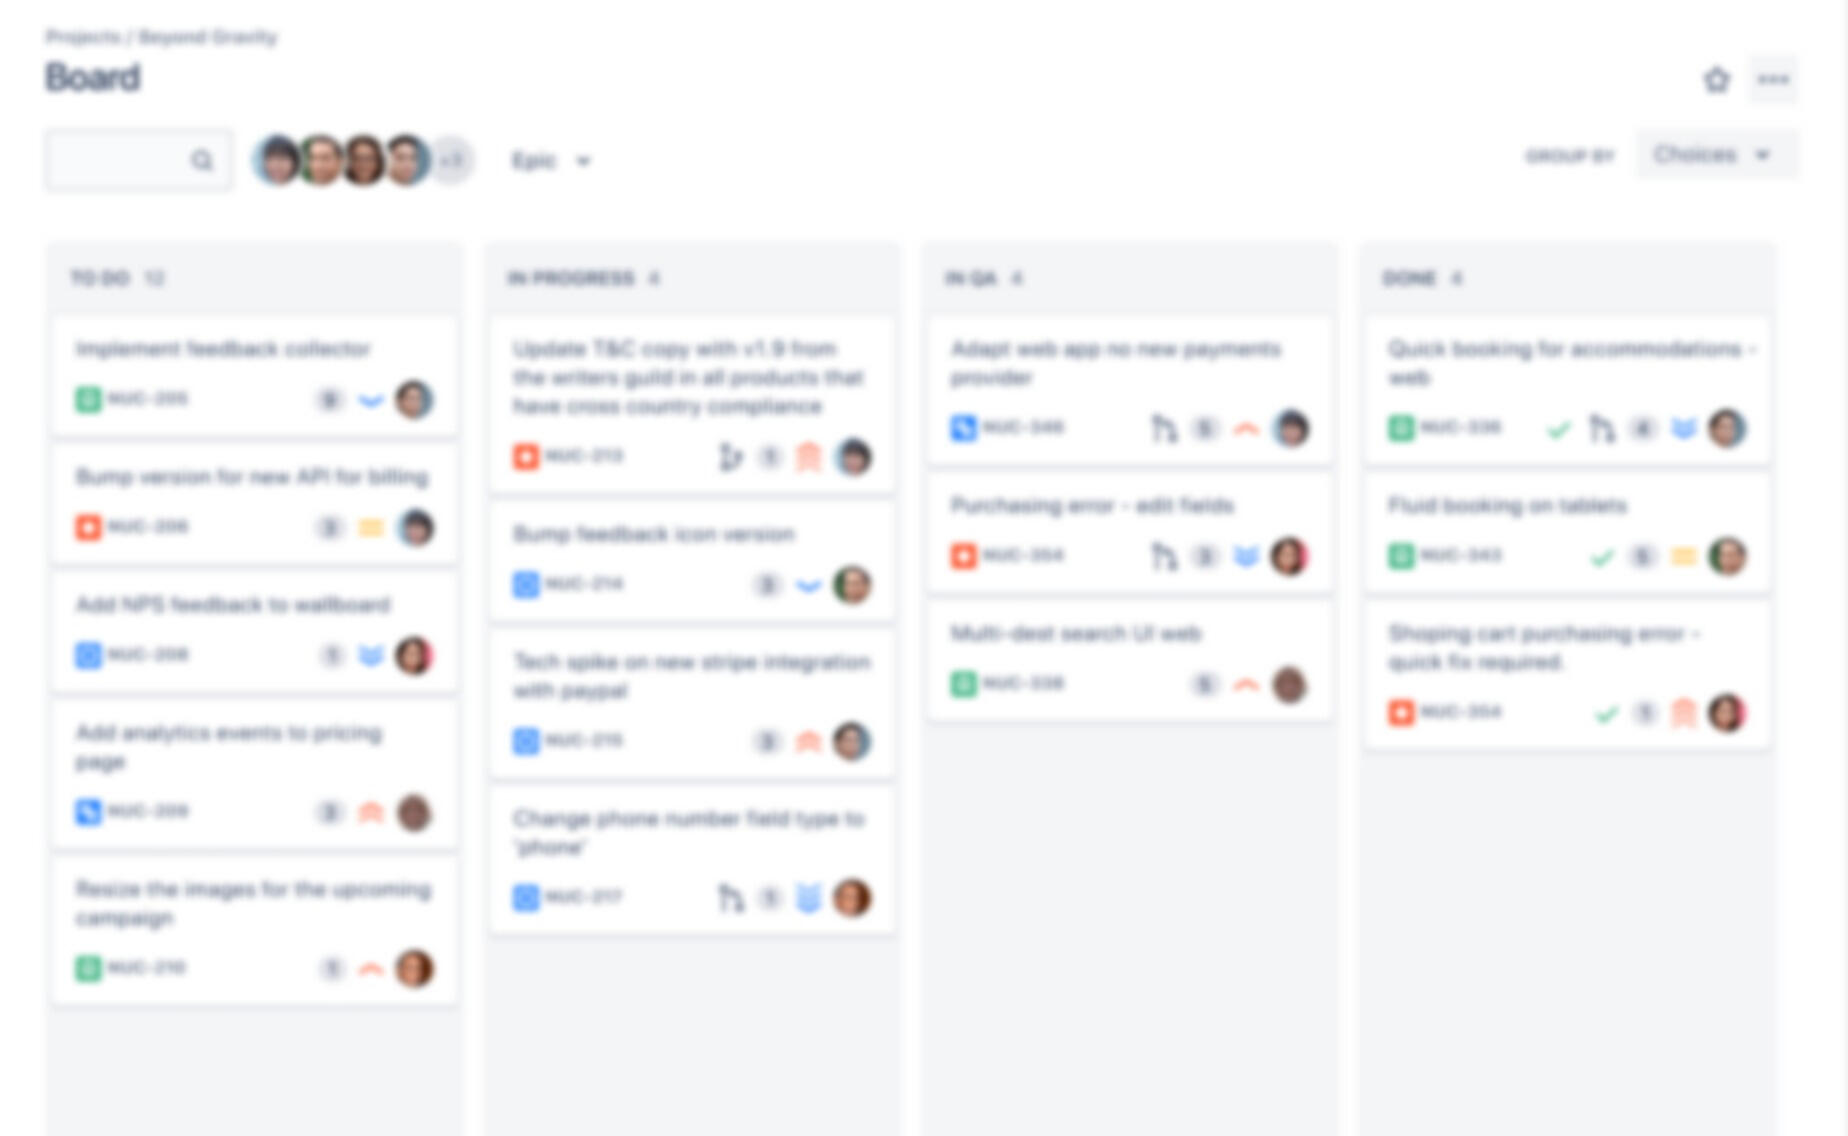
Collaborative Agile Development
Your dashboard evolves through a collaborative, iterative process. Starting with an initial version, we refine it through your feedback, employing Scrum or Kanban methodologies. Whether your team uses Jira, Trello, or any other project management tool, I seamlessly integrate into your workflow, ensuring a smooth and efficient development cycle.

All You Need to Do: Approve
No Detailed Requirements Needed - just share the basic objectives you have for your dashboard and the data at your disposal.We'll handle the rest with minimal input needed from your end.

Dashboard gamification
Step into the future of data analysis with interactive, gamified dashboards.Choose from cutting-edge, application-inspired dashboard designs to classic reporting themes. Engage more deeply with your metrics through a dashboard that’s both intuitive and exciting to use.Elevate your team's data interaction with a dashboard that's uniquely yours and reflect your business's character.

Unlock Time for Priorities
Imagine dashboards that don't just deliver data, but gift you time. My approach combines 8 years of certified experience with advanced optimization techniques to make your dashboards not only fast to load but also intuitive to use.This means you dive into insights quicker and step back sooner, freeing up your time for the important things.
Ready to Upgrade Your Dashboard?
Let's Get Started!
Book a 30-minute Intro Call with me to discuss dashboards that fits your unique role and boosts your career goals!
Let's talk about creating just that.
No Commitment, Just Conversation.
Client Endorsements: Why They Recommend Me
Discover the Experience of Working with Me Through Their Words


Got Questions?
We've Got Answers
Where are you based?
I'm located in the Azores Islands, Portugal (time zone: UTC/GMT -1).This places me within a 4-hour time difference from the East Coast (New York) and 2 hours from Central Europe (Berlin), facilitating convenient collaboration across 2 regions.
Do you have US citizenship and/or work under US clearance/ W2 terms?
No, I work as an international contractor and do not operate under US clearance or W2 terms.
How does the contracting process work?
You can hire me directly as an independent contractor or through Upwork. Both methods offer flexibility and security tailored to your project needs.
How can I be sure of your reliability and expertise?
My LinkedIn profile features recommendations from previous clients, attesting to my skills and reliability. Additionally, working through Upwork provides an extra layer of trust and professionalism.
Do you offer both hourly and fixed-price contracts?
Yes, I offer both options. I undertake fixed-price projects as well as hourly-based work, adapting to your project's specific requirements and scale.
Your journey to impactful, custom-designed
dashboard begins here
Let's turn your vision into a dynamic, user-friendly dashboard tailored to your role’s objectives!
Book your free personalized consultation and start your dashboard project!
We’ll never share your information with anyone.
Dashboards Paradise
Hryhorii (Greg) Fetisov —
Business intelligence expert.
Independent contractor/Freelancer
greg.fetisov@dashboardsparadise.com
Address
ESTRADA REGIONAL DA RIBEIRA GRANDE, 103, 9500-702 SÃO ROQUE, PONTA DELGADA, Azores, Portugal
© 2025 Hryhorii Fetisov. All rights reserved.
Your Request is in Good Hands!
Thank you for taking the initiative to connect with me. I'm thrilled about the opportunity to discuss how my custom dashboard solutions can specifically benefit your business.
What to Expect Next?
Rest assured, I'm currently preparing a response that's tailored just for you. Within the next 24 hours, you'll receive an email from me, detailing our next steps together. This email will provide all the necessary information, whether it's for setting up a personalized demo or arranging our introductory call.
Thank you,
Hryhorii 'Greg' Fetisov